
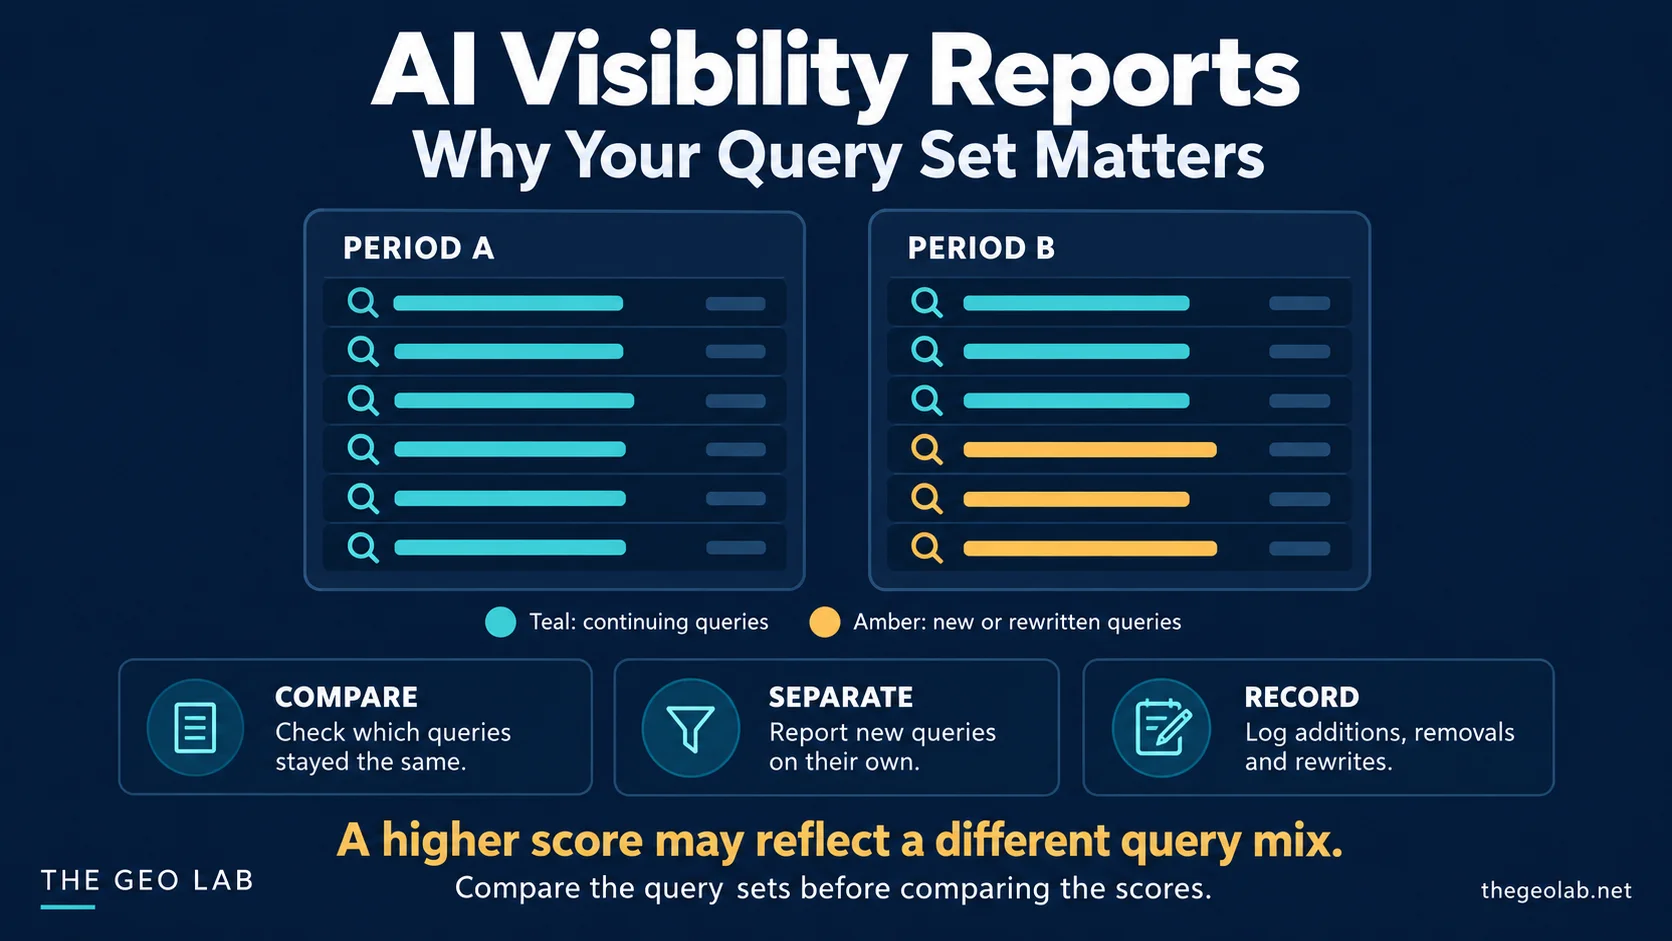
The percentage may have improved while the test itself has changed.
TL;DR
AI visibility reports depend on the queries included in the test. In two historical Perplexity API studies on The GEO Lab’s pages, citation rates differed by query category and length. These results support checking query-set consistency before comparing reporting periods. They do not establish a universal preference for short queries, a content-optimisation rule or current behaviour across AI search platforms. As of October 2026, most AI visibility reports I have reviewed do not disclose how or whether the query sample changed between periods.
Before I would celebrate an increase in AI visibility, I would check whether we asked the same questions as last time.
An AI visibility report might contain more queries that name a business, fewer commercial questions or a new set of longer prompts. Each change can alter what the score describes. The percentage may have improved while the test itself has changed.
Two of my Perplexity studies made me more cautious about this. I kept the target pages fixed within each study and varied the queries. Citation outcomes differed, and both studies challenged what I had expected to find.
The practical question is how to compare AI visibility reports when the query sample can influence the result.
AI visibility reports and the two studies that changed my view
AI visibility reports built on different query samples can produce different scores for the same pages. E026 compared query categories. E030 compared query-length tiers. Both collected repeated observations through the Perplexity API on a small set of The GEO Lab’s pages.
| Study | Query dimension | Sample | Collection window |
|---|---|---|---|
| E026 | Ten researcher-defined categories | 150 queries × 5 days: 750 observations | 10–14 June 2026 |
| E030 | Three word-length tiers | 45 query variants × 5 days: 225 observations | 19–23 May 2026 |
These are two collections from the same research group and site, with overlapping target pages. They are not independent replications of one effect. Their results also should not be pooled into a single citation rate.
Query categories produced different citation rates
The E026 query-type report records a 38.7% citation rate for Tutorial queries and 1.3% for Transactional queries. Each category contributed 75 observations across the five target pages. I had expected fact-seeking queries to perform near the top. Factual queries came in at 9.3%, while Tutorial queries had the highest rate. The result did not match the predicted category ordering.
For AI visibility reports, the useful finding is the difference between categories within that sample. It gives us a reason to inspect the mix of queries behind a report’s overall score. It does not establish that tutorials are the best content format to publish.
Going deeper? The GEO Experiments — Design, Measure, Learn ebook covers experiment design, measurement protocols, and how to interpret results from studies like E026 and E030.
Longer queries had lower citation rates in E030
In the E030 query-length report, combined rates dropped from 61.3% for short queries (2–4 words) to 16.0% for long queries (10–12 words) — a 45.3 percentage point gap across 225 observations. The registered prediction had been the reverse: longer queries would cite more often.
That finding belongs to these pages, query variants and collection conditions. Adding words can also add meaning or narrow the question. The data does not isolate word count from every change in semantic specificity.
Why a changing sample complicates AI visibility reports
AI visibility reports combine outcomes from the queries included in them. If the proportions of query groups change, the combined score can move even when each group’s rate stays the same.
Here is a hypothetical example, using invented values to show the arithmetic. It is not a reconstruction of either experiment.
| Query group | Citation rate (both periods) | Period A observations | Period B observations |
|---|---|---|---|
| Group 1 | 60% | 50 | 80 |
| Group 2 | 10% | 50 | 20 |
| Combined | Depends on the sample mix | 35% | 50% |
In Period A, the groups contribute 30 and 5 citations: 35 out of 100. In Period B, they contribute 48 and 2: 50 out of 100. Neither group improved. The overall rate rose by 15 percentage points because the sample contained more observations from the higher-rate group.
This is why I would want the query-set history beside AI visibility reports that show a trend. Without it, I cannot tell whether I am looking at a comparable test. The ten measurement variables that change between citation runs include query phrasing as one of the most consequential.
Keep a consistent query set for the trend
AI visibility reports that track progress over time need a fixed query set as the basis of the period-to-period comparison. I would still add new questions when products, services or customer needs change. I would report those additions separately until there is a clear decision to establish a new baseline.
| Part of the report | Purpose |
|---|---|
| Continuing query set | Compare the same questions over time |
| Newly added queries | Explore questions that were not in the previous report |
| Removed or rewritten queries | Record where comparability changed |
This is my proposed reporting procedure. E026 and E030 did not test whether adopting it improves business outcomes. The 30-check citation protocol prescribes a fixed 10-query set for the same reason: changing the queries changes the score.
Treat a rewrite as a recorded change
“Massage Cambourne” and “Which massage therapist in Cambourne offers evening appointments?” ask different questions. The second introduces an availability condition as well as more words.
Those are illustrative queries, not cases from either study. I would not replace one with the other in a recurring set and describe the change as cosmetic. I would keep the earlier wording, record the replacement date and explain the reason. That gives a later reviewer a way to identify when the test changed.
Show AI visibility reports results by query group
AI visibility reports that present a combined score can still be useful, provided the report shows what went into it. I would break the results down by the query distinctions relevant to the business. That might include named-business questions and category-discovery questions, or questions about different services.
The groups should be defined before reviewing the outcomes. Otherwise, there is a temptation to create a category around whichever results look strongest.
| Reporting field | What I would retain |
|---|---|
| Query text | The wording used in the capture |
| Query-set version | Which reporting sample it belongs to |
| Group | The classification used for comparison |
| Target | The page, domain or entity being assessed |
| Collection conditions | Platform, surface, date and recorded account conditions |
| Outcome | The defined observation, with its supporting capture |
| Change note | Why a query was added, removed or rewritten |
This article concerns query selection. For the collection procedure, use the citation-rate measurement protocol linked above; for unresolved observations, use the AI visibility denominator guide.
What the results do not establish
AI visibility reports built on these two studies carry specific limitations. The studies do not explain the internal mechanism behind the citation differences. In E026, the field labelled correct-page retrieval was derived from citation data. It therefore supplied no independent evidence of retrieval. I can discuss citation outcomes from that study, but I cannot use that field to identify where uncited pages left the pipeline.
E030 also does not establish that shortening a prompt improves the answer, helps a customer or reflects normal user behaviour. A query that produces more citations to my site may be a worse representation of what a customer actually asks.
I would choose an audit sample to represent the business question. Choosing only the highest-performing queries would make the score easier to improve and the AI visibility report less useful.
These are historical API results
The collections took place in May and June 2026 on Perplexity’s API. E026 used Sonar Pro through DataForSEO; E030 describes the same Sonar Pro API setup. They are not measurements of today’s consumer interface. Fresh testing would be needed before claiming the same category ordering or length gradient on a current platform.
The small page sets also limit generalisation. A broader replication would need additional sites and query variants, with semantic differences recorded rather than assumed away. The noise floor in citation measurement already introduces ±4–6pp day-to-day variance with no content changes.
What I would check before calling a change an improvement
AI visibility reports that claim an improvement need a baseline comparison. I would start by comparing the query lists from the two periods. If they differ, I would calculate the trend for the continuing queries separately from the newly added ones.
Then I would inspect the group-level results. A gain confined to named-business questions needs a different explanation from a gain across category-discovery questions.
If the continuing sample improved under comparable conditions, I would investigate what changed on the site or platform. A content edit could be one candidate explanation. These two experiments do not establish which website intervention caused a gain in a later report.
Frequently asked questions
Can changing the query set change an AI visibility score?
Yes. Changing the proportion of higher- and lower-rate query groups can move the combined AI visibility score even if each group’s rate stays constant. This is a sample-composition effect, not a measurement error.
Should I use only short queries in a citation audit?
No. The sample should represent the question you are trying to answer. E030’s historical short-query result does not establish that short queries are always the right choice for AI visibility reports. Choose queries that reflect how your audience actually searches.
Do Tutorial queries always receive more AI citations?
E026 found a higher citation rate for Tutorial queries within its sample of 750 Perplexity observations. That result does not establish the same ordering across different websites, topics or current AI search platforms.
Can I add new queries to a monthly AI visibility report?
Yes. Identify new queries separately and preserve the continuing-query comparison. If the new sample replaces the old one, mark the new baseline and record the replacement date so a later reviewer can identify when the test changed.
Did these studies test current ChatGPT or Google AI Overviews?
The numerical results discussed here came from historical Perplexity API collections in May and June 2026. They should not be presented as current findings for other AI search products. Fresh testing would be needed to confirm the same patterns on current platforms.
How do I compare AI visibility reports from different periods?
Start by comparing the query lists from both periods. If they differ, calculate the trend for the continuing queries separately from newly added ones. Then inspect group-level results. A gain confined to one query type needs a different explanation from a gain across all categories.
Key GEO Lab Takeaway
- AI visibility reports depend on the queries included. The same pages produced different citation rates under different query categories (E026) and different query lengths (E030).
- A combined score can rise when no individual query group improved. The sample composition effect moves the percentage without any change in underlying performance.
- Keep a fixed query set for period-to-period comparison. Report new queries separately until there is a decision to establish a new baseline.
- Show group-level results beside the combined score. Define the groups before reviewing outcomes, not after seeing which results look strongest.
Ready to apply this? Run the 10 GEO audit checks on your pages, and use the reporting checklist above to structure AI visibility reports that disclose their query-set composition.
Questions? Contact The GEO Lab.